A warehouse might look organized on paper, with designated pedestrian routes, clearly marked storage areas and carefully planned vehicle movements. But daily operations often tell a different story.
Forklifts take shortcuts, employees gather around busy loading bays, and temporary storage gradually occupies valuable floor space. Small changes in how people and equipment move can create congestion, delays and safety risks.
Operations managers need reliable information about how facilities actually function before deciding what to change.
Heatmaps provide that visibility. Using data from cameras and computer vision technology, they visualize movement patterns, activity levels and recurring risk locations across industrial environments.
Instead of relying entirely on observations or assumptions, teams can use these visual insights to make better decisions about workspace layouts, traffic routes and resource allocation.
What Are Heatmaps in Industrial Operations?
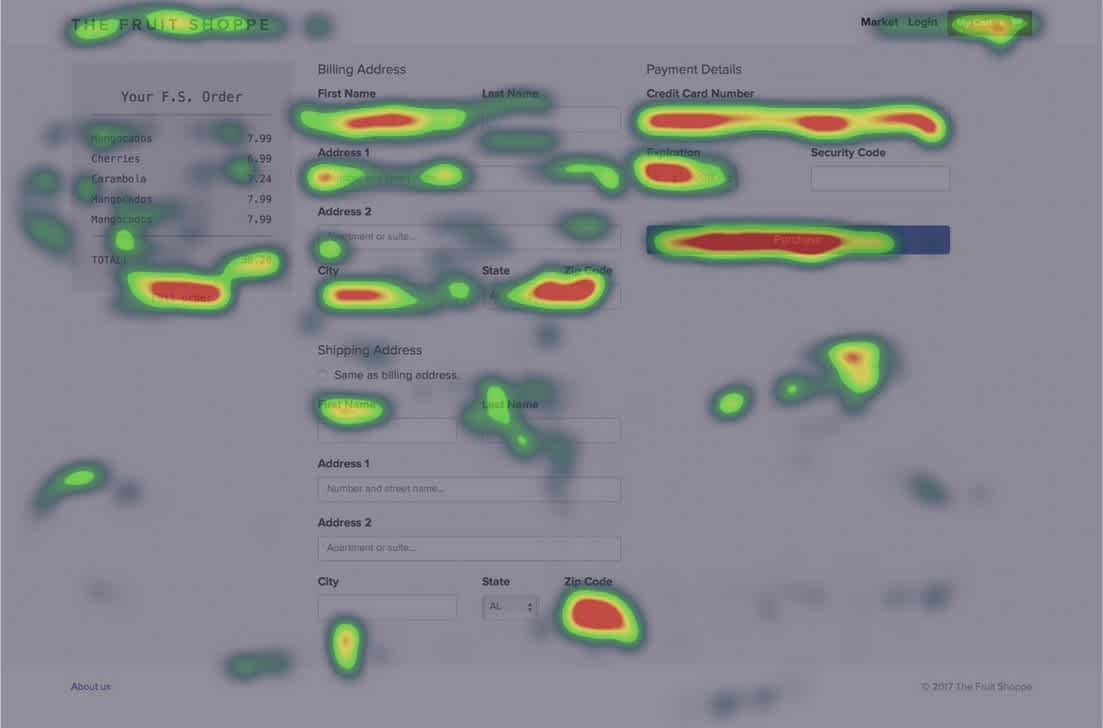
A heatmap is a visual representation of activity across a defined space. Different colors or levels of intensity highlight areas with higher concentrations of movement, occupancy or recorded events.
In warehouses, manufacturing facilities and distribution centers, heatmaps help managers identify how employees, vehicles and equipment use available space.
For example, a warehouse heatmap might reveal heavy activity around one loading dock while another remains relatively quiet. A separate visualization could highlight repeated pedestrian and forklift interactions at a particular intersection.
These patterns provide useful evidence for reviewing facility layouts and working practices.
Modern industrial AI platforms can generate heatmaps using computer vision analysis of existing CCTV footage. Depending on the system, teams may also filter information by time period, shift, camera location or event category.
That additional detail helps distinguish occasional congestion from recurring operational problems.
How Heatmaps Reveal Problems With Existing Facility Layouts
Identifying Congested Traffic Routes
Congestion creates challenges in facilities where people, materials and industrial vehicles share limited space.
Aisles that appear wide enough during quiet periods may become difficult to use when several forklifts operate simultaneously.
Heatmaps can highlight locations where movement repeatedly concentrates, helping managers investigate what causes the buildup.
Consider a distribution center where vehicles regularly converge near the receiving area. Visual analysis might show that forklifts serving two storage zones use the same narrow passage.
Operations teams could then assess alternative routes, adjust delivery schedules or introduce clearer traffic controls.
The important distinction is that decisions follow observed activity rather than assumptions about how employees should move through the facility.
Finding Underused Space
Industrial space is expensive, particularly when organizations face pressure to increase storage capacity or production output.
Yet some facilities consider expansion before examining how much of their existing floor area they actually use.
Heatmaps can help identify sections of a building that experience relatively little activity compared with surrounding zones.
These observations may reveal opportunities to relocate storage, reorganize workstations or introduce new operational functions without immediately expanding the building.
Low activity alone doesn’t mean an area is unnecessary. Emergency access routes, maintenance clearances and temporary staging areas may need to remain available even when usage appears limited.
Managers should interpret utilization data alongside operational requirements and safety regulations before making changes.
Spotting Recurring Safety Risks
Facility layout decisions affect workplace safety as well as productivity.
Poorly positioned storage racks, obstructed walkways and shared vehicle routes can increase the likelihood of hazardous interactions.
Event heatmaps help safety teams identify where particular observations occur repeatedly.
For example, a concentration of forklift near misses around a warehouse corner may indicate restricted visibility or inadequate separation between pedestrians and vehicles.
Instead of relying solely on additional employee training, managers can investigate physical improvements such as barriers, revised routes or relocated equipment.
Heatmaps don’t independently establish the cause of an incident. They help teams identify locations that warrant closer investigation.
How AI-Powered Area Utilization and Path Mapping Improve Decisions
Traditional facility assessments often involve manual observations, employee interviews and periodic traffic studies. These methods remain useful, but they capture limited periods of activity.
AI-powered analysis can provide a broader picture by examining movement across multiple shifts and operational conditions.
For example, Protex AI offers area utilization and path mapping capabilities that help industrial teams examine traffic patterns, movement trends and how different zones are used.
The platform combines several analytical features to support layout planning:
- Area utilization analysis: Examines activity across cameras and zones to identify underused or congested spaces.
- Path mapping: Visualizes movement patterns to show how people and vehicles travel through monitored areas.
- Time-lapse analysis: Allows teams to review how workspace activity changes over time.
- Event mapping: Uses heatmaps to highlight recurring event locations, with filters for risk categories and shifts.
- Clearway analysis: Helps identify blocked pathways and locations where walkway access requires attention.
These capabilities give operations managers additional evidence when considering route changes, workspace reorganization or adjustments to traffic management procedures.
They also help EHS teams evaluate potential safety consequences before recommending modifications.
Using Heatmaps to Compare Activity Across Different Shifts
A layout that works well during one shift may create problems during another.
Production schedules, delivery volumes, staffing levels and equipment availability can significantly change how industrial spaces are used.
Heatmap analysis helps managers examine those differences.
For example, daytime warehouse activity might concentrate around picking areas, while overnight operations generate heavier traffic near dispatch doors.
Comparing both periods could reveal that a planned storage relocation would interfere with overnight vehicle movements.
Shift-level analysis also helps organizations distinguish consistent layout problems from temporary pressures.
A loading bay that experiences congestion only during a scheduled delivery window may require changes to scheduling rather than a permanent redesign.
Reviewing different operating periods before committing to modifications reduces the risk of solving one problem while creating another.
Turning Heatmap Insights Into Practical Layout Changes
Collecting movement data provides a starting point. The real value comes from using that information to improve how a facility operates.
Operations teams can follow a structured process when reviewing layout changes.
- Identify the operational problem: Define the congestion, safety concern or space limitation that needs attention.
- Review activity patterns: Examine heatmaps across relevant areas, shifts and time periods to identify recurring trends.
- Investigate the causes: Combine visual analytics with site inspections, employee feedback and operational records.
- Develop a proposed change: Consider revised traffic routes, equipment relocation, storage adjustments or updated working procedures.
- Measure the results: Compare activity patterns and relevant safety or productivity indicators after implementation.
For instance, a facility might relocate pallet storage after identifying repeated congestion near a packing station.
Subsequent analysis could show if vehicle movements have become more evenly distributed and if the original bottleneck occurs less frequently.
Teams should also monitor potential unintended consequences, including new congestion points or longer travel distances.
This approach helps managers justify layout changes with evidence rather than relying on anecdotal observations alone.
What Operations Managers Should Consider Before Using Heatmaps
Heatmap quality depends on the information available to the analytical system.
Camera positioning, lighting conditions, visual obstructions and detection accuracy can all influence the results.
Areas outside camera coverage won’t appear in the analysis, so managers should avoid treating partial visibility as a complete representation of facility activity.
Teams should also distinguish movement density from actual operational performance.
A busy area isn’t necessarily inefficient. Some workstations naturally require frequent activity, while certain production processes depend on concentrated material flows.
Interpreting heatmaps alongside throughput, waiting times, equipment usage and safety observations provides more useful context.
Employee privacy also deserves consideration. Organizations should establish appropriate data handling procedures and communicate how workplace monitoring supports operational improvement.
Making Layout Planning More Evidence-Based
Industrial layouts rarely remain optimal forever. Production demands change, equipment moves and daily working practices develop beyond the original facility plan.
Heatmaps help operations teams recognize these changes before they contribute to persistent congestion or avoidable safety risks.
Combined with path mapping and area utilization analysis, visual activity data can reveal how a workplace actually functions across different locations and shifts.
That insight helps managers prioritize improvements, assess proposed changes and measure their impact after implementation.
Start with a specific operational concern, such as recurring forklift congestion or underused storage space. Review existing camera coverage, examine activity patterns and compare the findings with direct observations from employees.
Better layout decisions begin with knowing how people and equipment use the space available. Heatmaps provide a practical way to turn that knowledge into informed operational improvements.